
Using the console
The admin console is a web app served by the server at https://<KESTREL_PUBLIC_HOSTNAME>/. It talks only to the server's REST API (/api) and updates live through server-sent events, so new alerts and status changes appear without a reload.
The sidebar has two groups:
- Respond: Overview, Incidents, Alerts, Devices, Hunt, Response.
- Configure: Policies, Agent updates, Rules, Exclusions & IOCs, Quarantine, Review requests, Settings.
What you can see and change depends on your role (admin, analyst or readonly; see Settings). For a picture of every page, see the Console tour.
Keyboard shortcuts
Press ? anywhere for the list.
| Keys | Action |
|---|---|
Ctrl+K (or Cmd+K) | Command palette: jump to a page, device or incident |
/ | Search |
G then O, I, A, D, H, P | Go to Overview, Incidents, Alerts, Devices, Hunt, Policies |
J / K | Next / previous row in a table |
Enter / Shift+Enter | Open the side drawer / the full page |
X | Select a row for bulk actions |
Arrow up / down, O | In the incident queue: previous / next incident, open the full page |
Overview
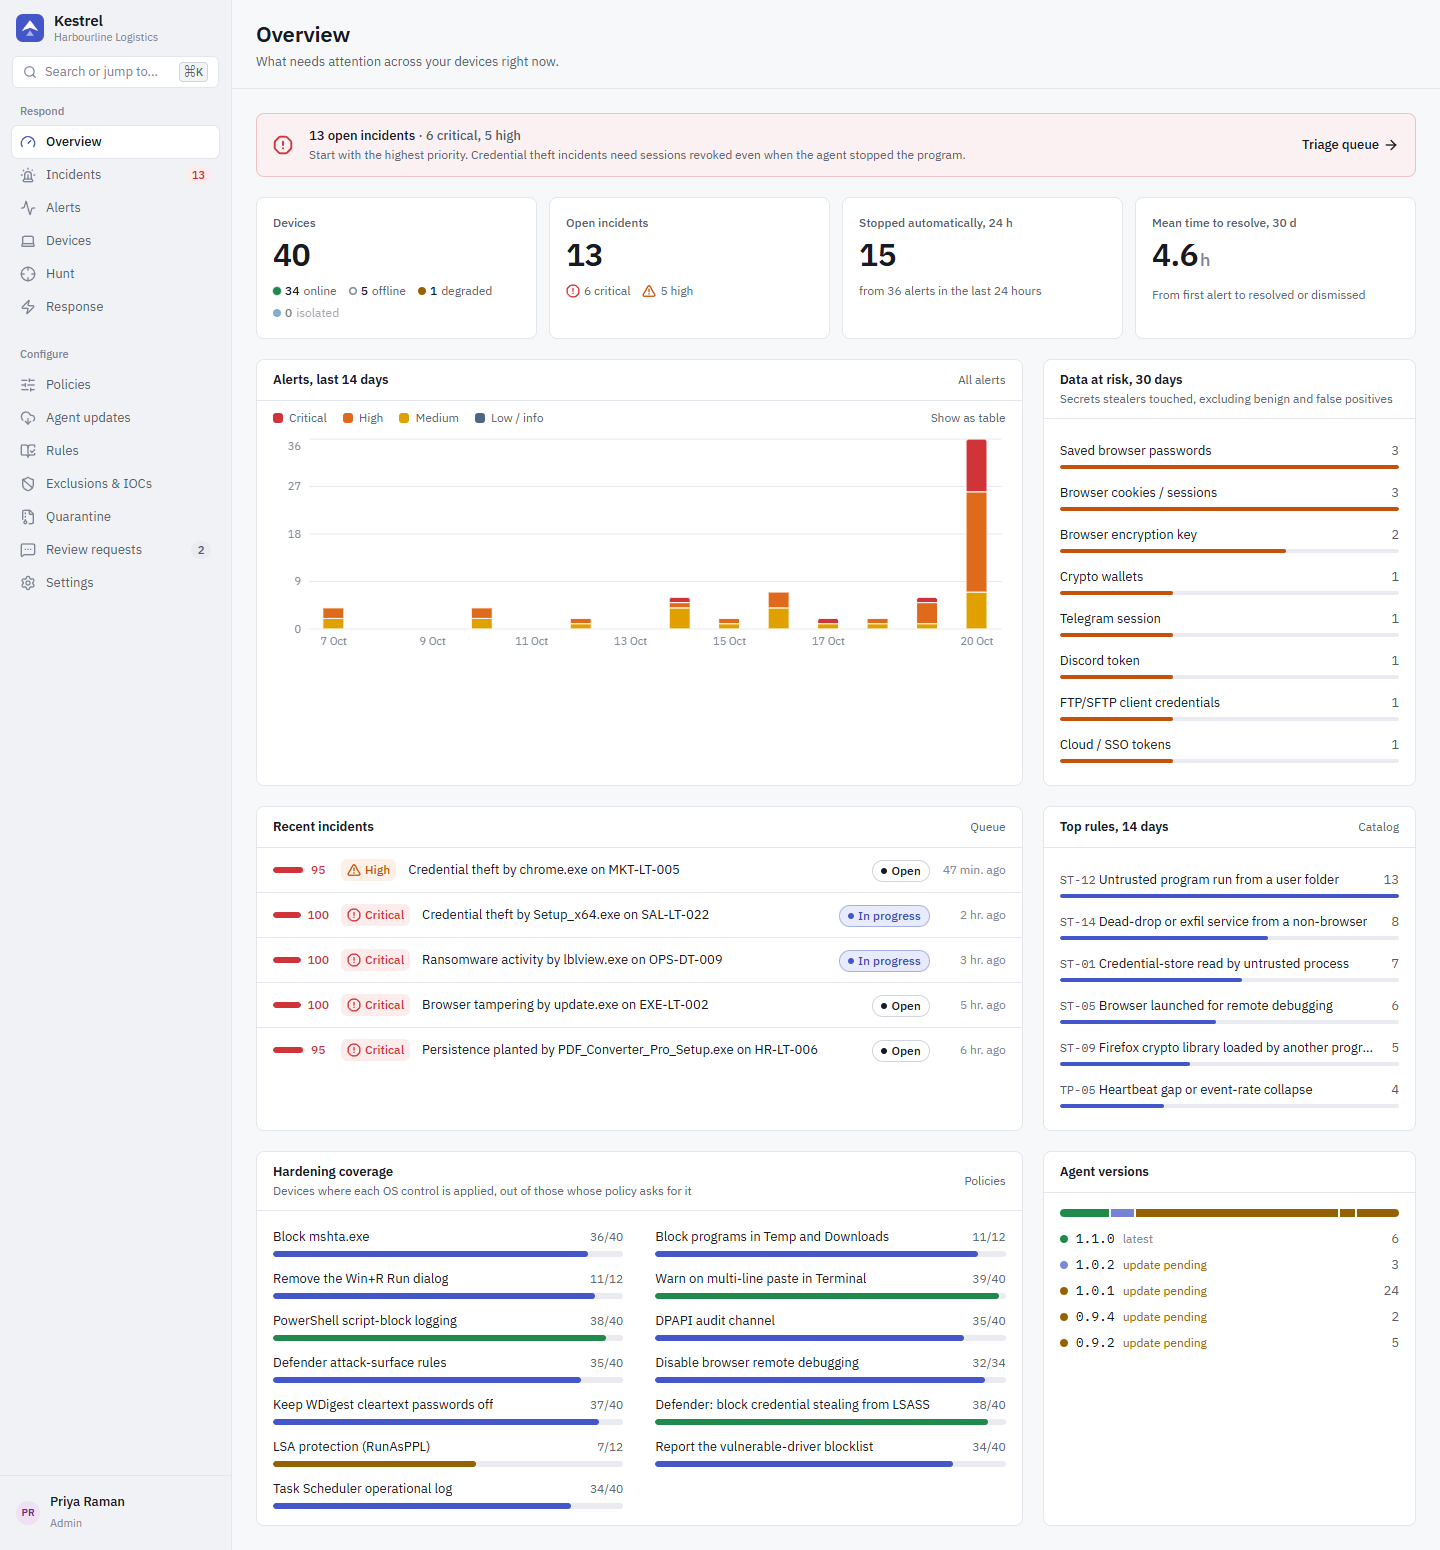
The Overview page answers "what needs attention right now": open incidents by severity, alerts over the last 14 days, the categories of data stealers touched in the last 30 days, recent incidents, the top rules of the last 14 days, hardening coverage across devices, and the agent versions in the fleet.
Incidents
The server groups alerts into incidents: alerts on the same device join the same incident if they share a root process tree (the topmost non-system ancestor) within 30 minutes, or if an open incident is rooted at one of the alert's ancestors. A ClickFix chain (Explorer RunMRU entry, then PowerShell, then the payload) therefore becomes one incident.
The incident queue is sorted by priority (0 to 100). Priority starts from the highest alert severity and goes up when data is at risk, when an impact-stage rule fired (exfiltration, ransomware, credential dumping), and when the process was not contained.
Titles say what happened, for example "Credential theft by labsim.exe on WKS-01", "Ransomware activity by ...", "Credential dumping by ...", "Persistence planted by ..." or "Agent tampering on ...".
The incident page
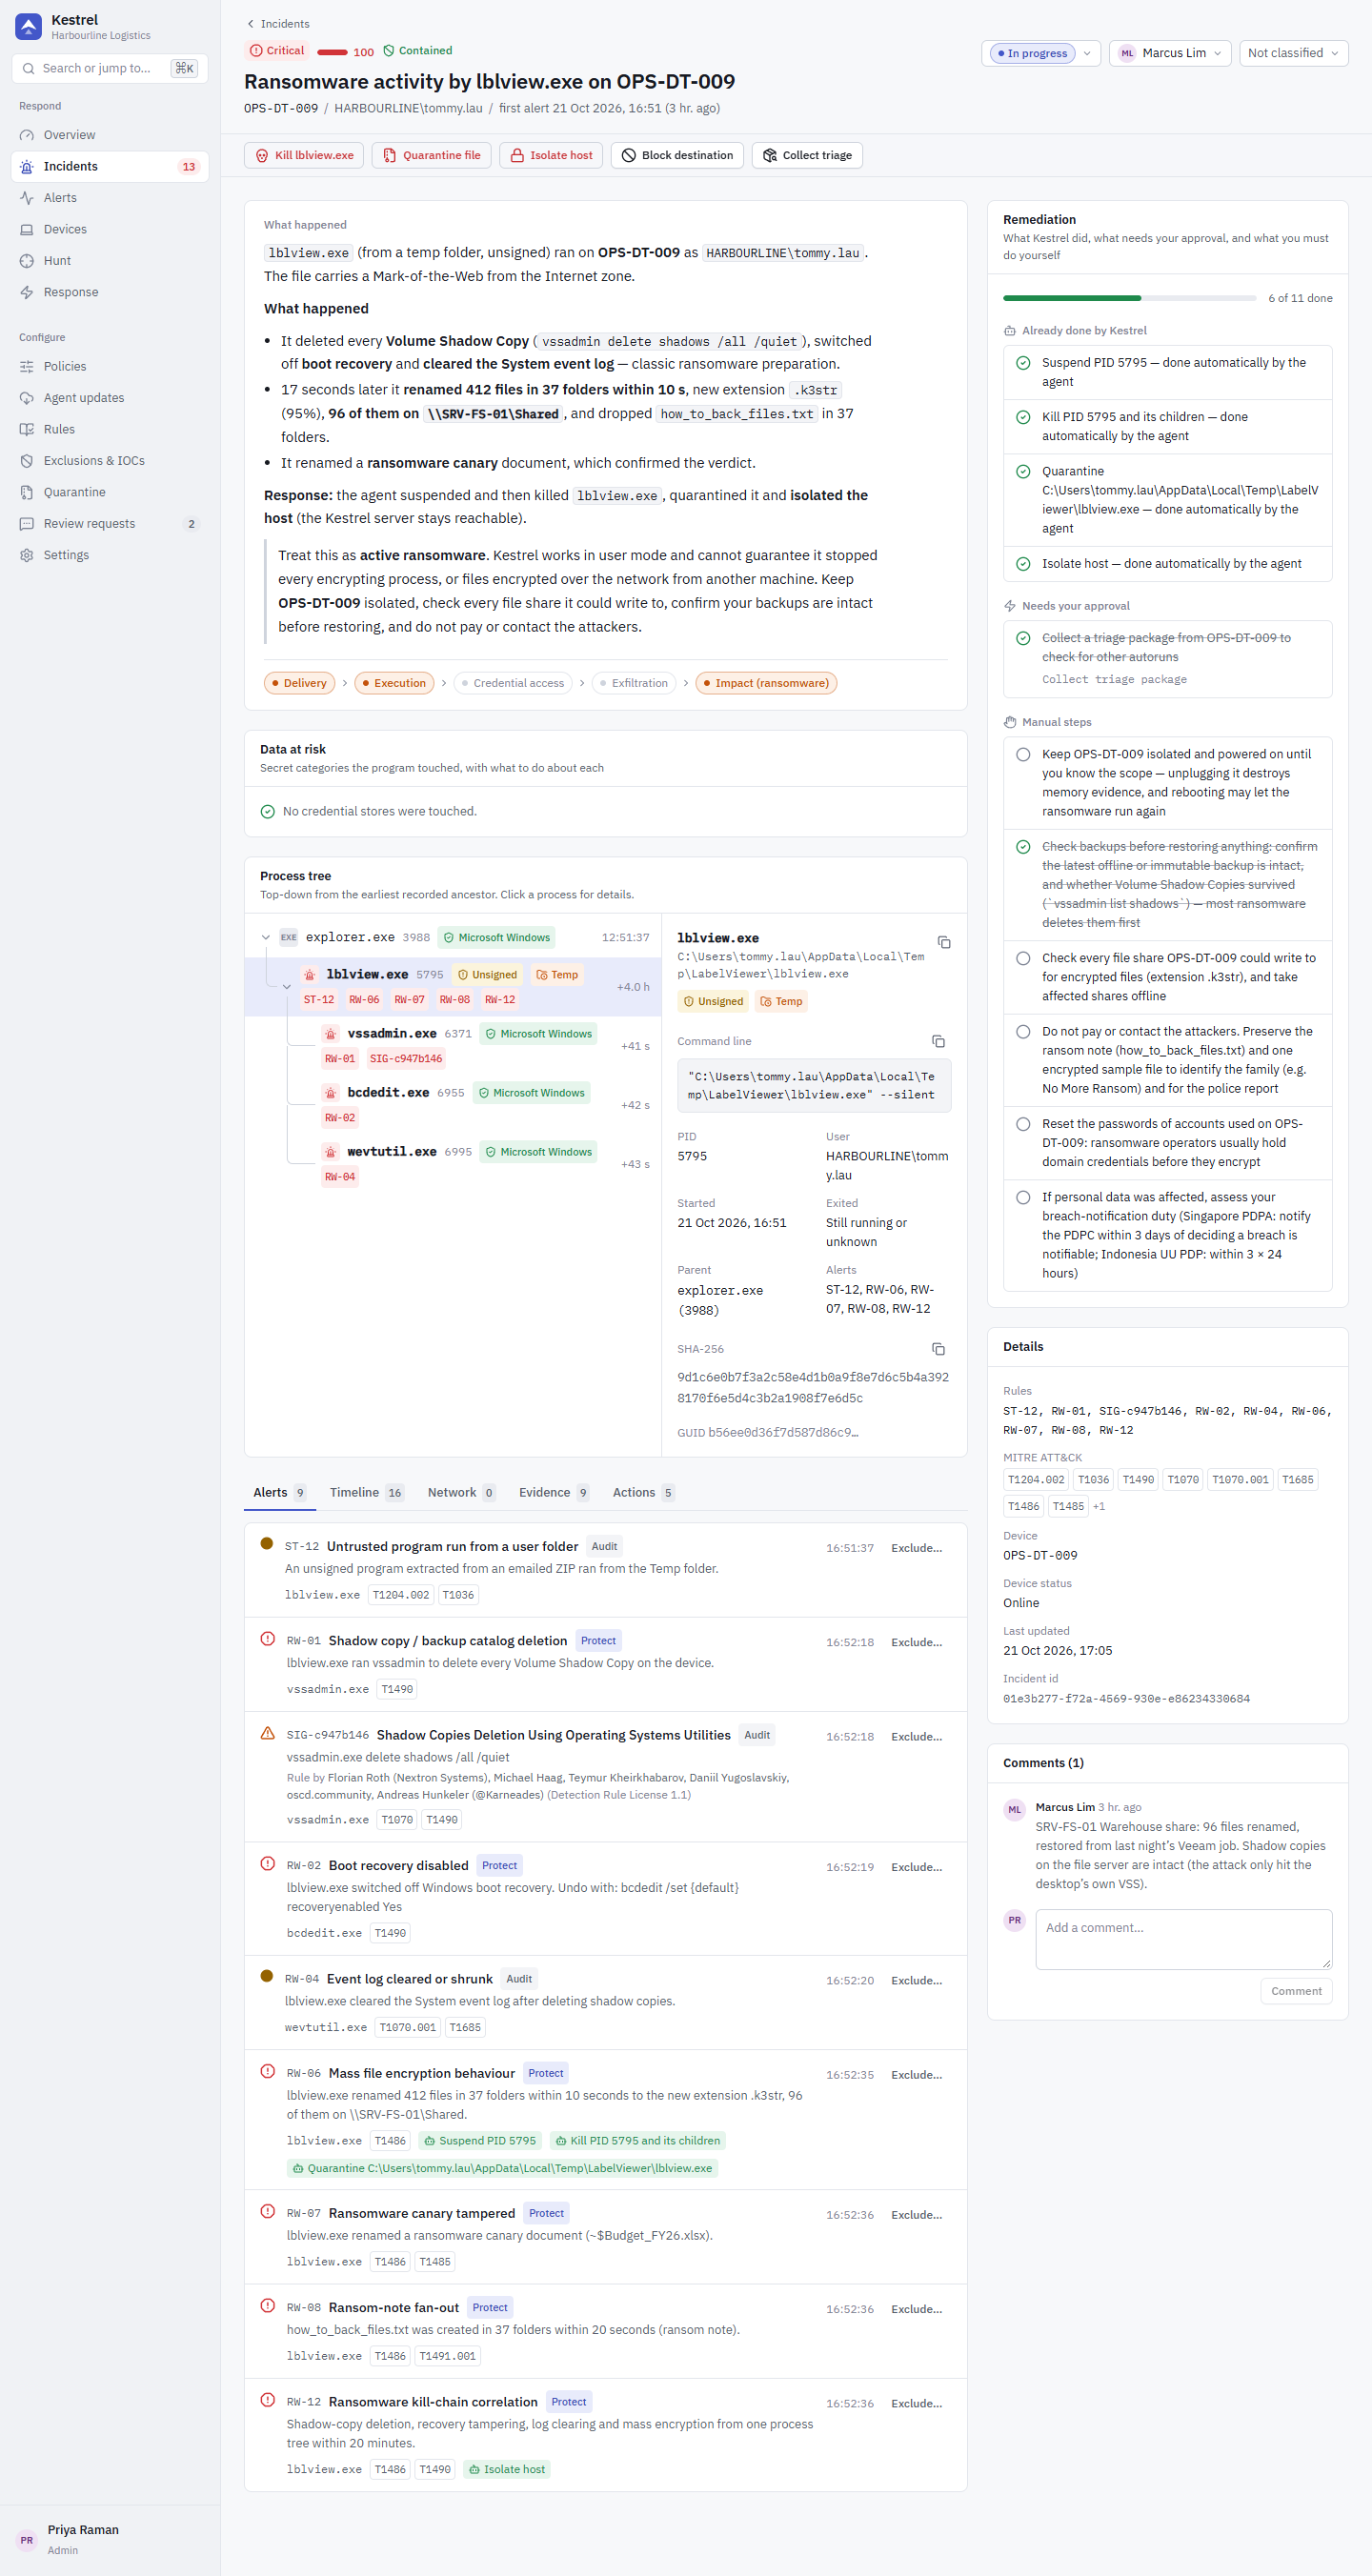
- What happened: a plain-language storyline built from the alerts in time order. Evidence is written in words, for example how many files were renamed with which new extension, or which scheduled task was created with which command.
- Data at risk: the secret categories the program touched (browser passwords, cookies, autofill, the browser master key, crypto wallets, Discord, Telegram, Steam, FTP clients, VPN, cloud tokens, password managers, email, SSH keys), each with what to do about it.
- Process tree: top-down from the earliest recorded ancestor, with signer, hash, path class and the rules that fired on each process.
- Remediation checklist with three kinds of items:
- Done: what the agent already did (killed, quarantined, blocked).
- Approve: one-click response actions waiting for an analyst. Approving one queues the action; you need permission for that action as well as for incidents.
- Manual: steps only people can do, such as "revoke all web sessions" (a password reset alone does not invalidate stolen cookies), resetting passwords of accounts used on the host, checking backups, or assessing breach notification under PDPA or UU PDP.
- Details: status (open, in progress, resolved, dismissed), assignee, classification (true positive, false positive, benign) and comments.
- Tabs: Alerts, Timeline (alerts, actions, comments and status changes), Network (connections, with blocked ones marked), Evidence (the recorded events, explained; see below) and Actions (response actions with their result).
Reading evidence
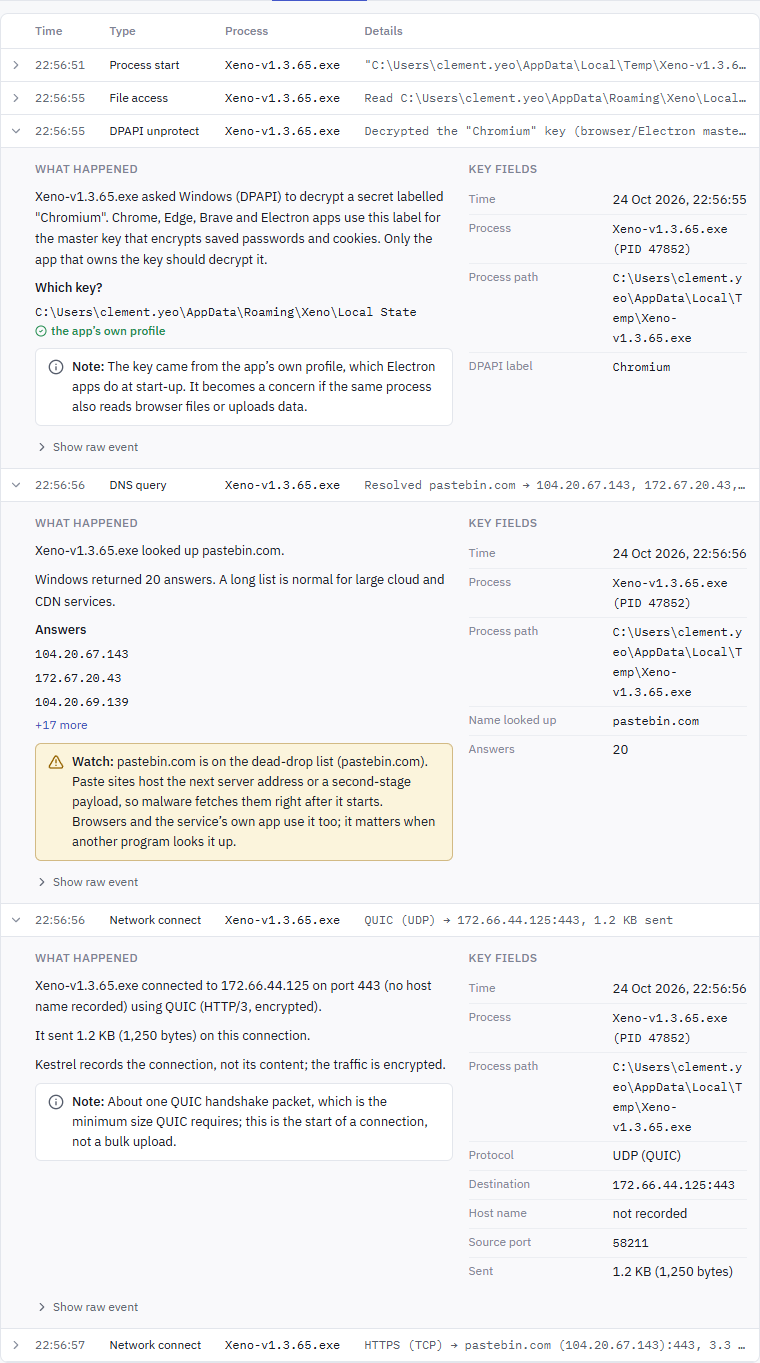
Each evidence row has a one-line summary. Click a row to expand it:
- What happened: one or two sentences about this event with its own values. Examples:
- A DPAPI decrypt names the key label and what uses it. "Chromium" is the label Chrome, Edge, Brave and Electron apps give the master key for saved passwords and cookies. Which key? lists the
Local Statefiles the same process opened in the 10 seconds before, marked the app's own profile (its--user-data-diror its ownAppDatafolder) or a browser's key store (Chrome, Edge, Brave, Opera, Vivaldi, Yandex). An Electron app unlocking its own key is normal at start-up; a program unlocking a browser's key is how stealers read saved passwords. - A network connection gives the protocol in words (UDP 443 is QUIC, TCP 443 is HTTPS), the host name if one was recorded and how much was sent. About 1.2 KB over QUIC is one handshake packet, not an upload; more than 100 KB is flagged as a large upload. Kestrel records connections, not their content.
- A DNS lookup shows the first three answers with the rest behind "+N more", and says why a name matters when it is on the dead-drop list (Telegram, Steam, Pastebin, file-drop and IP-lookup services).
- A process access decodes the access mask into named rights (for example
PROCESS_VM_READ) and says when Windows refused the request. - File opens name the credential store when the path is recognisable (browser passwords, cookies, wallets, Telegram, cloud keys).
- A DPAPI decrypt names the key label and what uses it. "Chromium" is the label Chrome, Edge, Brave and Electron apps give the master key for saved passwords and cookies. Which key? lists the
- Key fields: time, process and PID, and the fields that matter for this kind of event.
- Show raw event: the event exactly as the agent sent it, with a copy button.
The same view is used in the device event timeline and in Hunt results. Explanations only use the events on the page: on a device timeline filtered to one event type, or in Hunt, the file opens behind a DPAPI decrypt may not be listed.
Persistence incidents add an approve item per autorun entry found in the evidence (Run value, Startup file, scheduled task, service, WMI subscription), which removes the entry after backing it up into the quarantine vault. When a network block on a program succeeded, a "Lift network block ... (only if it was a false positive)" item is added.
Alerts
The Alerts page lists every individual detection, with rule, severity, ATT&CK techniques, mode (Audit or Protect), summary, process and the actions the agent took. Statuses are new, acknowledged and closed, and can be changed in bulk. Use it to review Audit-mode rules during rollout; use Incidents for triage.
From an alert you can create an exclusion with Exclude..., which shows exactly what the exclusion would hide before you save it. See Rules, exclusions and IOCs.
For alerts raised by SigmaHQ rules, the rule's authors are shown on the alert, as the Detection Rule License requires.
More
- Devices: sensor health, timeline, process tree, effective settings, hardening, inventory, uninstall token.
- Response actions: kill, quarantine, block, isolate and their rules.
- Hunting: the filter language.
- Rules, exclusions and IOCs, Policies, Agent updates, Quarantine and review requests, Settings.